
GeoAI Made Simple: Where to Start, What to Learn, and How to Apply It
You have heard about GeoAI. You may have seen models finding buildings, identifying trees, comparing satellite images, or turning photographs into 3D scenes. But when you try to learn it, you quickly meet a long list of unfamiliar names.
Where should you begin? Do you need to learn every model? And how do you know which approach fits your project?
Start with the problem you want to solve, not the model everyone is talking about.
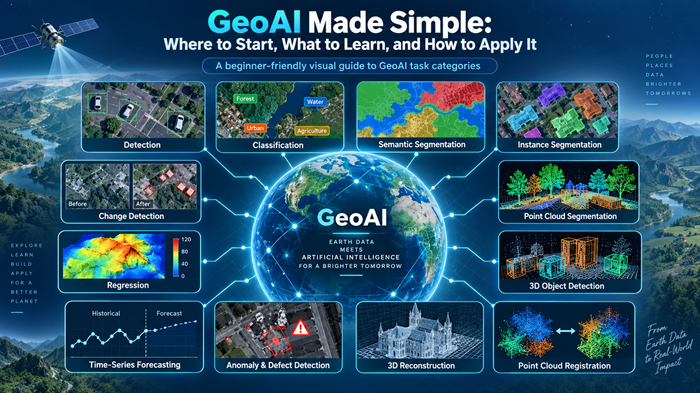
This guide introduces twelve useful GeoAI task categories, explains them through simple examples, and points you toward models and learning resources.
What Is GeoAI?
GeoAI means using artificial intelligence with geographic information. Geographic information is data connected to a location, such as satellite imagery, building locations, land records, 3D survey points, or readings from environmental sensors. GeoAI uses patterns in this information to identify features, estimate quantities, detect changes, and support decisions. It is not limited to satellite images or one particular type of AI. ArcGIS Pro
For example, imagine that you want to study trees in a town. Your question determines the task:
Finding tree locations is different from outlining each tree’s canopy. Estimating tree height is another task, while comparing tree cover between two dates is another.
The subject stays the same. The result you need changes the method.
Understand the Difference Between a Task and a Model
A task describes the job: finding objects, assigning categories, outlining shapes, or predicting values.
A model is a system used to perform that job. For example, object detection is a task, while YOLO is a model family used for detection. Its detection models return object locations, labels, and confidence scores—numbers expressing the model’s confidence in its predictions. Ultralytics Docs
You will also encounter two important terms:
A pretrained model has already learned from an earlier collection of data. Fine-tuning means training that model further using examples relevant to your own problem. Starting with a pretrained model can be useful, but its original training does not automatically make it suitable for every geographic area or object type. PyTorch
The following categories follow the learning structure available on GISSchools. They are a practical way to organize your learning, rather than completely separate branches of technology. GISchools
1. Detection: Finding Objects in an Image
Detection answers: “What objects are present, and where are they?”
The model usually draws a rectangle around each object it finds. This rectangle is called a bounding box. The result may also include the object’s category and a confidence score. Detection locates an object, but the box does not describe its detailed shape. Ultralytics Docs
A simple example: Imagine an aerial image of a parking area. Your goal is to find the vehicles and count them. You need their locations, not a carefully traced outline of every vehicle.
Models to explore: YOLO26n is a compact object-detection model. RT-DETR, including its R18 variant, is another model for locating and identifying objects in images. Both provide starting points for detection work, with custom training available for new datasets. Ultralytics Docs
What to learn first: Practise drawing correct bounding boxes and reviewing missed objects and incorrect detections. Keep the distinction clear: a box around a tree is not a measurement of its canopy boundary.
To study these models in more detail, visit GISSchools GeoAI and choose Detection.
2. Classification: Giving Something a Category
Classification answers: “What type of thing is this?”
In image classification, a model assigns a category to an image or image tile. An image tile is simply a smaller piece cut from a larger image. For example, a tile might receive the label “forest,” “water,” or “residential area.” Classification can also be applied to individual objects or data records. Esri Documentation
A simple example: Suppose you have a folder of satellite-image tiles. You want to organize them into groups showing farmland, settlements, and water. You are asking for a label for each tile—not a boundary around every feature inside it.
Models to explore: ResNet-18 is an image-classification model that is useful for learning how image recognition works. Vision Transformer, or ViT, is another approach that processes an image as a collection of smaller patches. Both can be adapted to new image categories through appropriate training. Hugging Face
What to learn first: Create clear category definitions. Decide how to label mixed images—for example, a tile containing both houses and farmland—before preparing your training data.
To learn more about classification and its models, visit GISSchools GeoAI and choose Classification.
3. Semantic Segmentation: Labelling Every Pixel
Semantic segmentation answers: “Which category does each part of this image belong to?”
A pixel is one of the small cells that make up a digital image. Instead of assigning one label to the whole image, semantic segmentation assigns a category to each pixel. The result is a class map showing features such as roads, vegetation, water, and buildings. ArcGIS Pro
A simple example: Imagine creating a map of vegetation across a neighbourhood. The model marks vegetation pixels in green and other surfaces in different colours. This gives you a mapped region rather than a single label saying that vegetation exists.
Models to explore: DeepLabV3, including the ResNet50 version, and SegFormer B0 are models for semantic segmentation. Both produce pixel-level predictions, although they use different internal designs. PyTorch Documentation
An important distinction: semantic segmentation can mark several neighbouring trees as vegetation without giving each tree a separate identity. Separating individual objects requires an instance-level approach. Esri Documentation
What to learn first: Practise creating pixel labels, checking boundaries, and comparing the predicted class map with a carefully prepared reference.
For detailed model explanations, visit GISSchools GeoAI and choose Semantic Segmentation.
4. Instance Segmentation: Outlining Each Individual Object
Instance segmentation answers: “Which pixels belong to each separate object?”
An instance means one individual example of something: one building, one vehicle, or one tree. Instance segmentation produces a separate mask for each detected object. A mask is a region showing the pixels assigned to that object. PyTorch Documentation
A simple example: Imagine five neighbouring buildings. Rather than marking all building pixels as one class, you want a separate outlined region for Building 1, Building 2, and so on.
Models to explore: Mask R-CNN predicts object categories, bounding boxes, and individual masks. SAM 2.1 can generate masks using guidance such as a clicked point or a box. However, SAM 2.1 does not automatically assign category names such as “building” or “tree”; identifying the class requires another step. PyTorch Documentation
What to learn first: Practise separating objects that touch or overlap. Also decide whether your workflow needs automatic category recognition or interactive assistance from a person.
To explore these models and their differences, visit GISSchools GeoAI and choose Instance Segmentation.
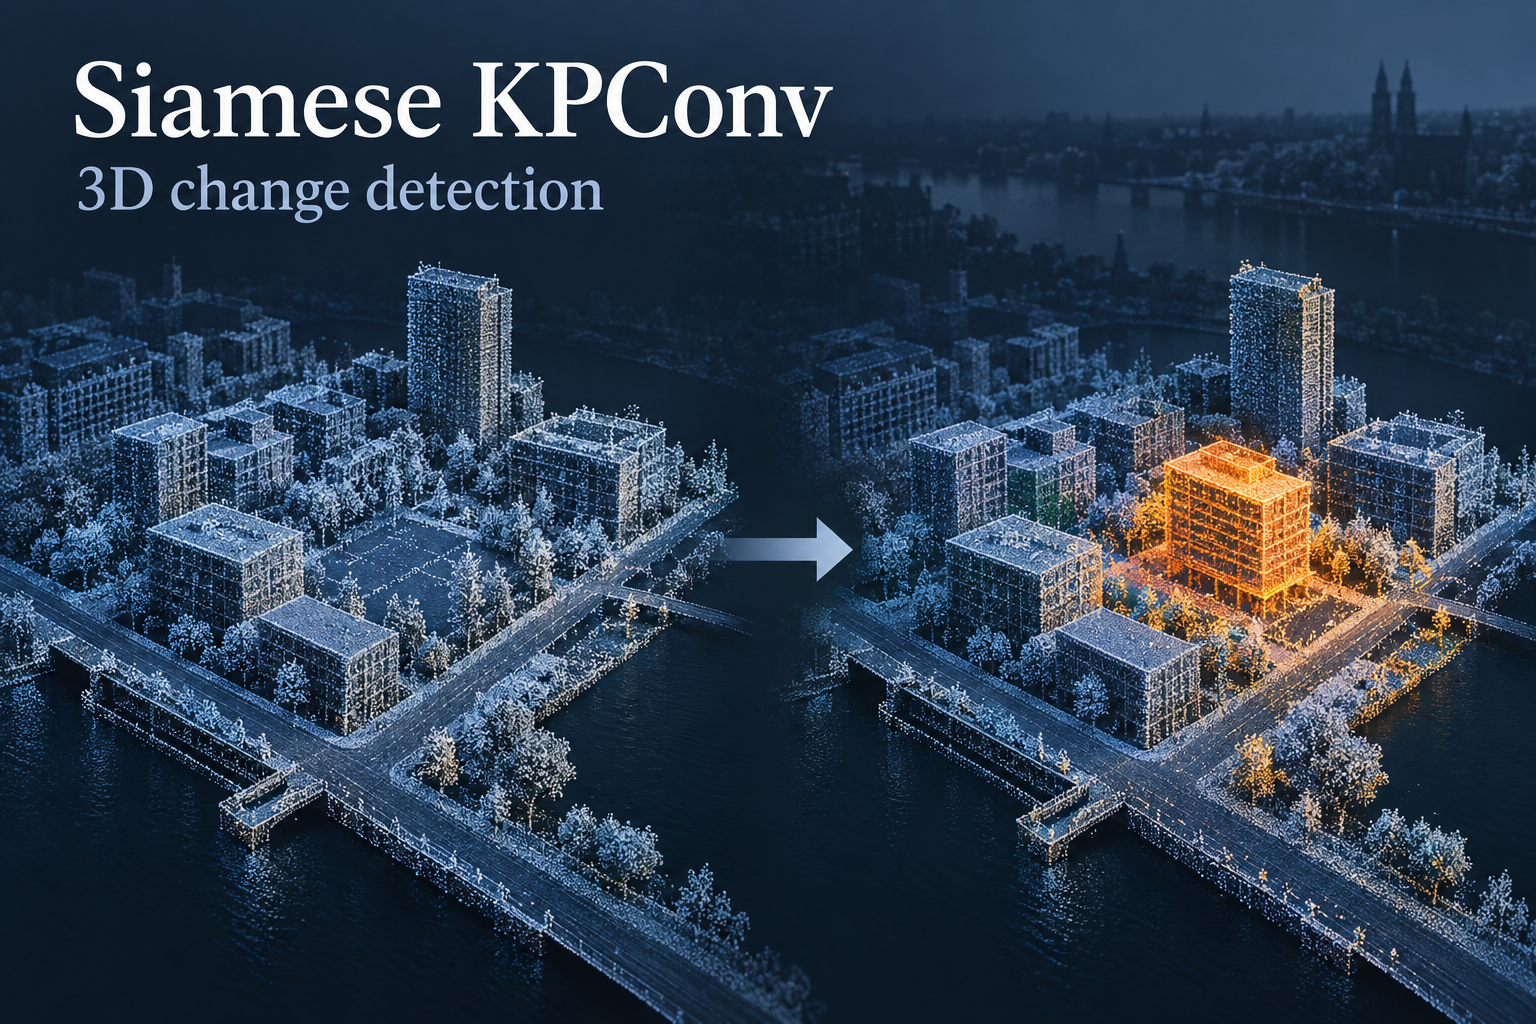
5. Change Detection: Understanding What Changed
Change detection answers: “What is different between these dates?”
The model compares observations of the same place at different times. For image-based change detection, the images must line up so that the same ground features occupy corresponding positions. This alignment is called co-registration. GitHub
A simple example: You have images of a neighbourhood from two different years. You want to highlight newly constructed buildings rather than manually inspect every street.
Models to explore: ChangeFormer and BIT, short for Bitemporal Image Transformer, are models for comparing images from two dates. Their published LEVIR-CD examples focus on building changes; those trained versions should not be assumed to recognize every kind of change. GitHub
What to learn first: Begin with two well-aligned images and a clearly defined change, such as buildings appearing or disappearing. Review whether apparent differences are genuine changes or effects of image conditions. Treat alignment and reference checking as part of the task—not optional cleanup.
For more detailed learning, visit GISSchools GeoAI and choose Change Detection.
6. Regression: Predicting a Numerical Value
Regression answers: “How much?” or “How high?” rather than “Which category?”
A regression model estimates numerical quantities. In geographic work, that can include predicting canopy height from suitable imagery. The output may be a value for a sample or an entire map of estimated values. GitHub
A simple example: Instead of simply identifying an area as vegetation, you want to estimate the height of the tree canopy across that area.
Models to explore: HighResCanopyHeight estimates canopy-height maps from suitable RGB imagery. RGB means the red, green, and blue colour channels used in ordinary colour images. The model’s height learning uses aerial LiDAR reference data. GitHub
Depth Anything V2 Small is another numerical-prediction example. Its standard relative-depth model estimates the relative depth of a scene from an image. Relative depth is not automatically a surveyed distance or a ground-elevation map in metres. GitHub
What to learn first: Understand what the predicted numbers represent, which units apply, and what independent measurements you will use to check them. A colourful height-looking image is not enough evidence of accurate measurements.
To explore these models further, visit GISSchools GeoAI and choose Regression.
7. Point Cloud Segmentation: Understanding a 3D Survey
Point cloud segmentation answers: “What does each part of this collection of 3D points represent?”
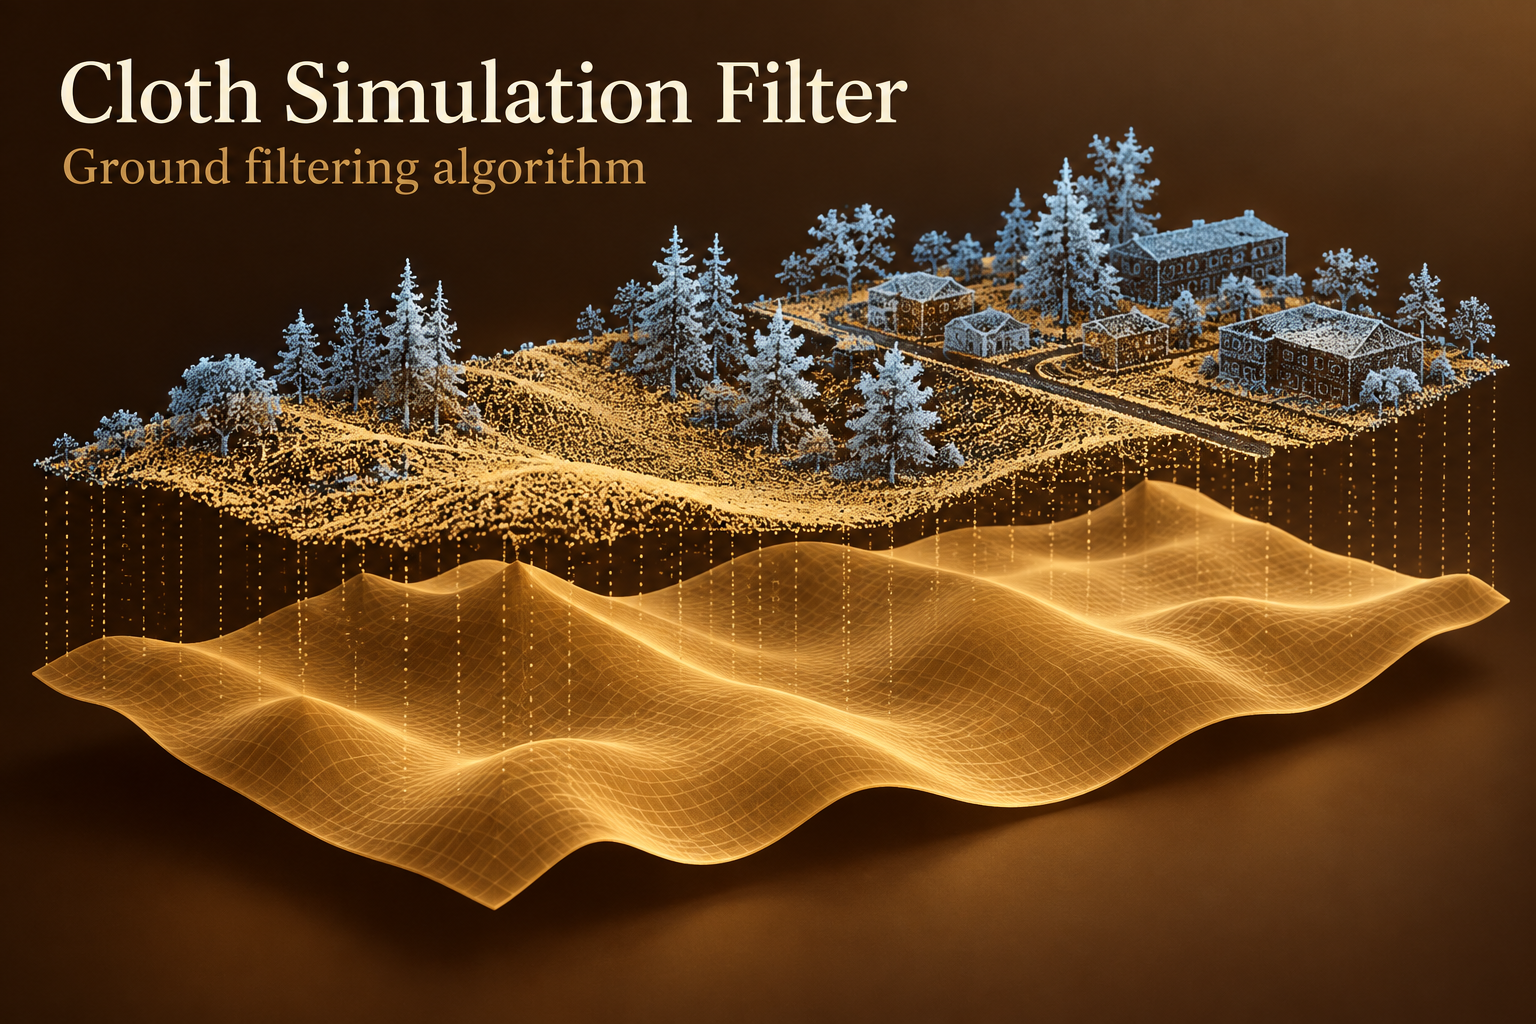
A point cloud is a collection of points positioned in three-dimensional space. Segmentation assigns categories to the points, helping separate features such as terrain, buildings, and vegetation. Unlike image segmentation, the analysis works with 3D points rather than a flat grid of image pixels. GitHub
A simple example: Imagine a survey containing a road, nearby buildings, and trees. Your goal is to distinguish the ground points from the building and vegetation points.
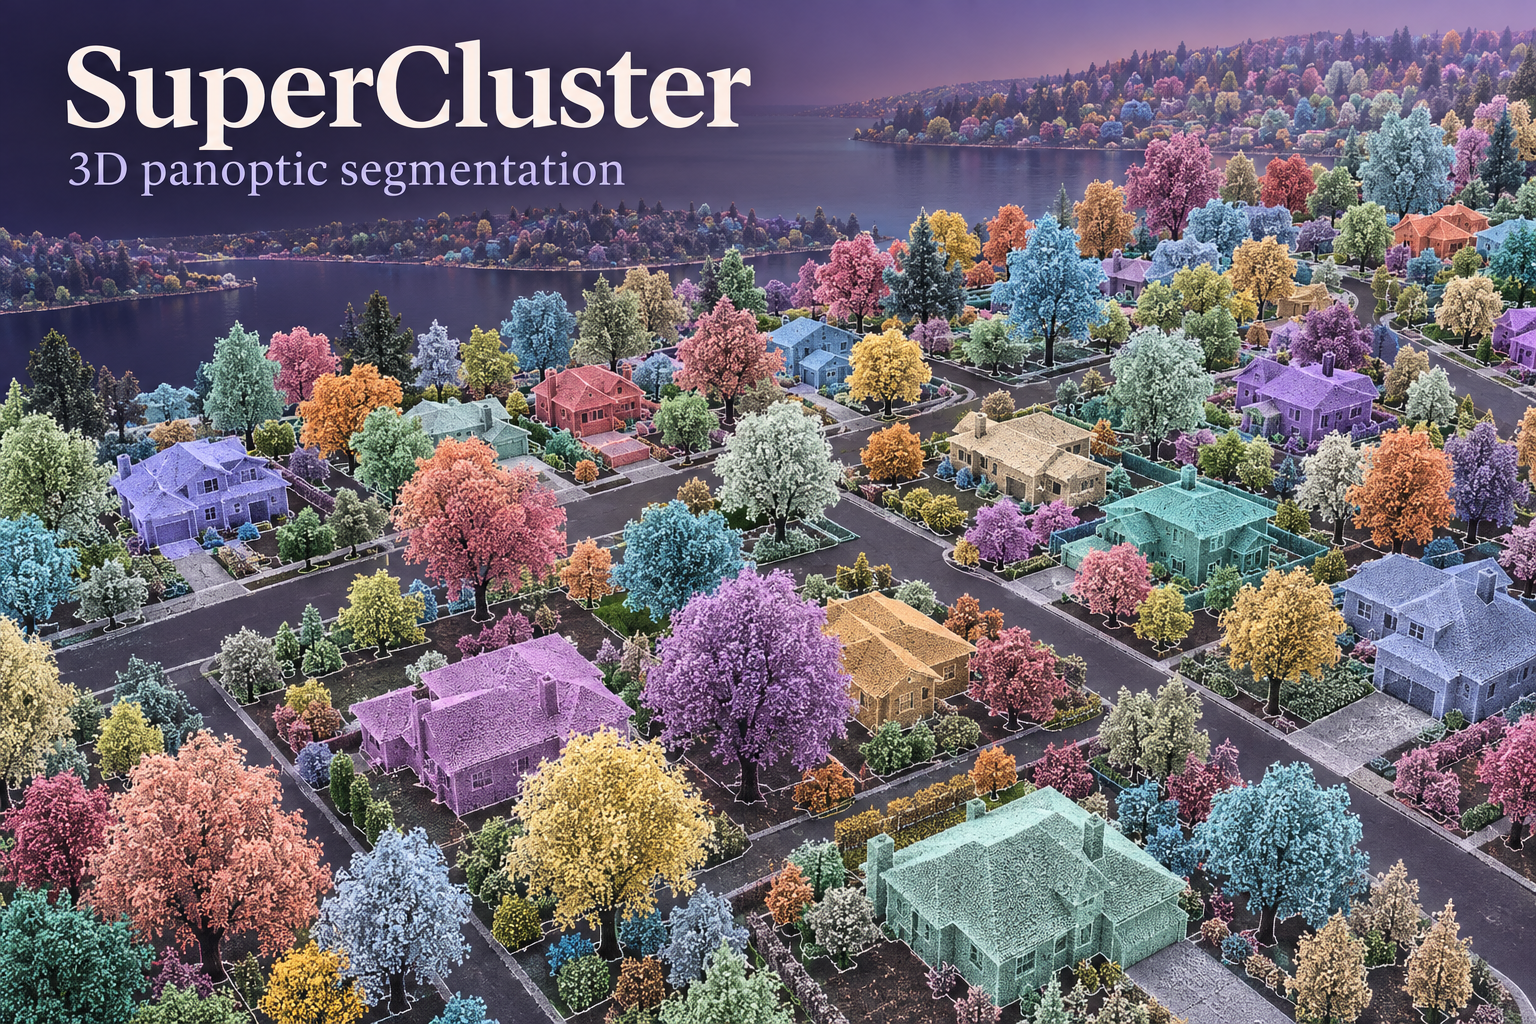
Models to explore: RandLA-Net is designed for semantic segmentation of large point clouds. Superpoint Transformer organizes points into meaningful groups called superpoints and uses relationships between those groups to support classification of the 3D scene. GitHub
What to learn first: Start by viewing a small point cloud and understanding its coordinates and existing labels. Practise checking whether the model correctly separates ground, vegetation, and buildings before attempting an entire city.
To learn about these models and their workflows, visit GISSchools GeoAI and choose Point Cloud Segmentation.
8. 3D Object Detection: Finding Objects in Three Dimensions
3D object detection answers: “Where is this object in 3D space?”
Instead of drawing a rectangle on a photograph, the model can place a three-dimensional box around an object. This box describes its estimated position, size, and orientation. arXiv
A simple example: Imagine a road captured by a LiDAR survey. You want to locate the vehicles as separate 3D objects, rather than only label the points as “vehicle.”
Model to explore: PointPillars is a model for detecting objects in point clouds. It organizes point information into vertical columns, called pillars, as part of its detection process. Its well-known KITTI application focuses on road-scene objects. arXiv
A model trained to find road users does not automatically become a detector for buildings, electricity towers, or every other survey asset. Those applications require appropriate training examples and testing. GISchools
What to learn first: Practise reading 3D boxes and understanding the target object classes. Check the coordinate system and units before interpreting box dimensions.
For a detailed introduction to PointPillars, visit GISSchools GeoAI and choose 3D Object Detection.
9. Point Cloud Registration: Making Separate Scans Line Up
Point cloud registration answers: “How should these scans be positioned so that they match?”
Two scans of the same location may overlap but sit in different positions or orientations. Registration estimates how to move and rotate them into a shared reference frame. GitHub
A simple example: Imagine scanning a building from two different positions. Both scans contain part of the same wall. Registration uses matching information to align the scans so that the shared wall appears in the same place.
Model to explore: GeoTransformer learns geometric relationships to find corresponding parts of overlapping point clouds and estimate their alignment. GitHub
What to learn first: Understand overlap, matching features, and alignment error. Check the result against stable surfaces and independent survey references. Two scans can look aligned without being correctly positioned in a real-world map coordinate system. GISchools
Keep the task separate from change detection: registration aligns the data; change detection investigates differences between observations.
To study registration and GeoTransformer in more detail, visit GISSchools GeoAI and choose Point Cloud Registration.
10. 3D Reconstruction: Building a 3D Representation
3D reconstruction answers: “What does this scene look like in three dimensions?”
In an image-based workflow, overlapping photographs provide different views of the same scene. A reconstruction method uses relationships between those views to estimate 3D structure. GISchools
A simple example: Imagine a set of photographs showing a building from several angles. Your goal is to create an estimated 3D representation that can be inspected from different viewpoints.
Model to explore: MASt3R supports image matching and 3D geometry estimation. It can form part of a reconstruction workflow rather than simply assigning labels to an image. GitHub
What to learn first: Study image overlap, coverage, scale, and georeferencing. Georeferencing means connecting the result to its real-world location. Review missing geometry and check reconstructed distances against independent measurements before using them for survey work. A convincing-looking model is not proof of measurement accuracy. GISchools
Also review a model’s usage conditions before including it in a commercial project; accessible code does not necessarily mean unrestricted use. GitHub
For further explanations and resources, visit GISSchools GeoAI and choose 3D Reconstruction.
11. Anomaly & Defect Detection: Finding Something Unusual
Anomaly detection answers: “Does this look different from what is expected?”
An anomaly is an unusual pattern. Some inspection models learn what normal, non-defective examples look like and then flag image regions that differ from those examples. arXiv
A simple example: Imagine inspecting photographs of similar surfaces or components. Most look normal. You want the system to highlight unusual regions for a person to review.
Model to explore: PatchCore uses examples of non-defective images to build a reference collection of visual patterns. It compares new images with that reference to identify and locate possible anomalies. arXiv
What to learn first: Define what “normal” means for your inspection task. Use consistent image conditions and review false alarms alongside missed problems.
Most importantly, an unusual appearance is a reason to investigate—not automatic proof of damage. Keep a human review step between an AI flag and any maintenance decision. In a GIS workflow, connect reviewed findings to the correct asset or location.
To understand PatchCore and related inspection concepts, visit GISSchools GeoAI and choose Anomaly & Defect Detection.
12. Time-Series Forecasting: Estimating What Comes Next
Time-series forecasting answers: “Based on previous observations, what values might come next?”
A time series is a sequence of measurements recorded over time. Forecasting uses earlier observations to estimate later values. Some models also provide a range of possible outcomes rather than only one prediction. Hugging Face
A simple example: Imagine daily water-demand readings from several locations. Your learning project could investigate whether those historical readings help estimate demand over the coming days.
Model to explore: Chronos-2 is a pretrained forecasting model that supports individual time series, multiple related measurements, and additional explanatory information. It can produce forecasts for several future steps with uncertainty information. Hugging Face
What to learn first: Understand timestamps, missing readings, measurement units, and recurring patterns. Evaluate predictions using earlier data to predict later data. Randomly mixing past and future observations can create a misleading test. Scikit-learn
Forecasting is different from change detection: one estimates future values, while the other examines differences between observations already collected.
For detailed learning resources, visit GISSchools GeoAI and choose Time-Series Forecasting.
Where Should You Start Learning?
You do not need to study all twelve categories at once. Choose a starting path that matches the data you understand and the result you need.
Start with the Geographic Basics
Begin by becoming comfortable with geographic data in a GIS application such as QGIS. Learn the difference between raster data, which uses a grid of cells, and vector data, which represents features using points, lines, and polygons. Practise opening layers, inspecting their attributes, and understanding where they belong on a map. QGIS Documentation
A useful first exercise is to open one image and a matching feature layer. Check whether they align and whether the image contains enough visible detail for your intended task.
Choose One Question and One Task
Write your goal in one sentence.
For example: “I want to locate vehicles in an aerial image.”
That gives you a focused detection project. Avoid expanding it immediately into segmentation, forecasting, and 3D reconstruction.
For image-based learning, classification or detection can be manageable starting exercises. For someone already comfortable with survey data, a small point-cloud segmentation exercise may be more relevant. Treat this as a suggested learning order—not a rule everyone must follow.
Learn the Basic AI Workflow
Learn how examples are prepared, how labels are assigned, how a model is trained, and how predictions are evaluated. Practise adapting an existing pretrained model before attempting to design a new model from scratch. This approach is called transfer learning. PyTorch
Learn enough Python to run an example, understand its input files, change a setting, and inspect the output. Focus on one working workflow before collecting a large number of libraries.
Check the Result Before Trusting It
Make evaluation part of every exercise.
Look for missed objects, incorrect labels, poor boundaries, or numerical errors. For geographic imagery, keep evaluation locations separate from training locations where appropriate; placing nearly identical neighbouring tiles in both sets can give a misleading impression of performance. Preserve the original imagery and coordinate information so that predictions can be checked in context. GISchools
For forecasting, keep the test period later than the training period. For 3D work, use independent reference measurements rather than relying only on visual appearance. Scikit-learn
How Do You Apply GeoAI in a Real Project?
Think of a GeoAI project as a complete workflow, not just a model download.
Start with a clear question. Find suitable data. Prepare the examples. Run or adapt a model. Review its mistakes. Then connect the accepted results to their correct geographic locations.
For a first project, aim for something small and complete: one defined area, one task, one model, and one checked output. Write down what worked, what failed, and what still needs manual review.
Do not judge success only by whether the output looks impressive. Ask a more useful question:
“Does this result answer the original question reliably enough to be useful?”
Final Thoughts
You do not need to memorize every model name to begin learning GeoAI.
Learn to recognize the problem first. Decide whether you need a label, a location, an outline, a comparison, a numerical estimate, a 3D result, or a forecast. Then choose the relevant category and study one model at a time.
Understand the task. Choose suitable data. Learn one model. Check the result. Build something useful.
Continue your learning at GISSchools GeoAI, starting with the category closest to your own project.

Comments
No comments yet. Start the discussion.
Leave a reply
Your email address will not be published. Required fields are marked.