
What this model does
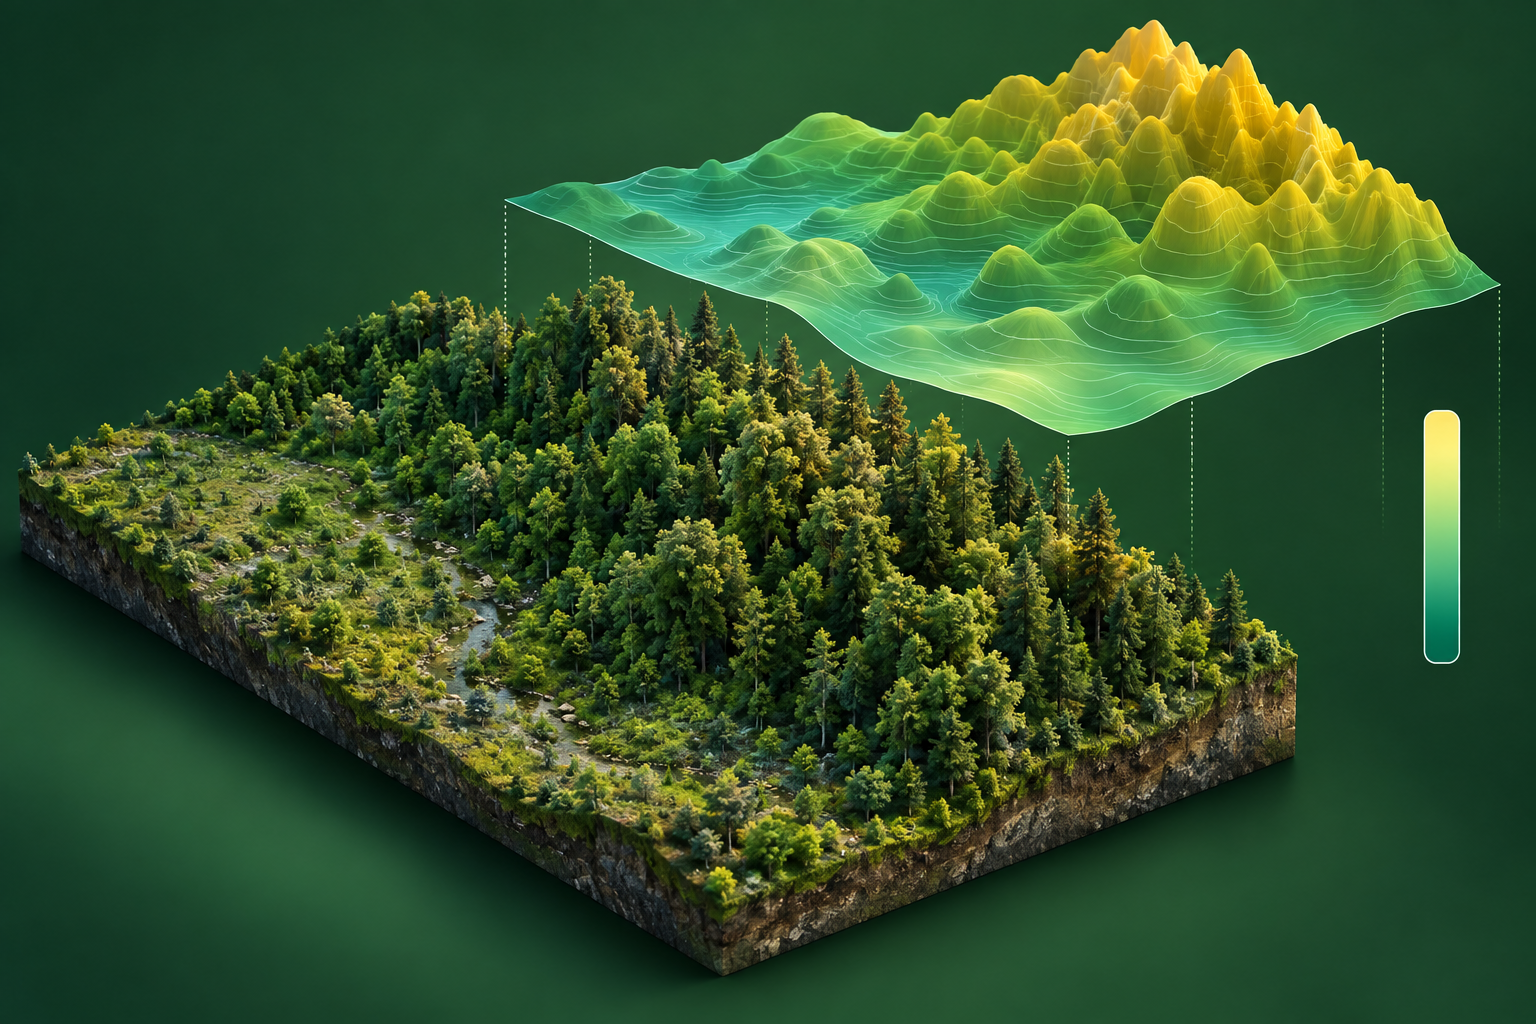
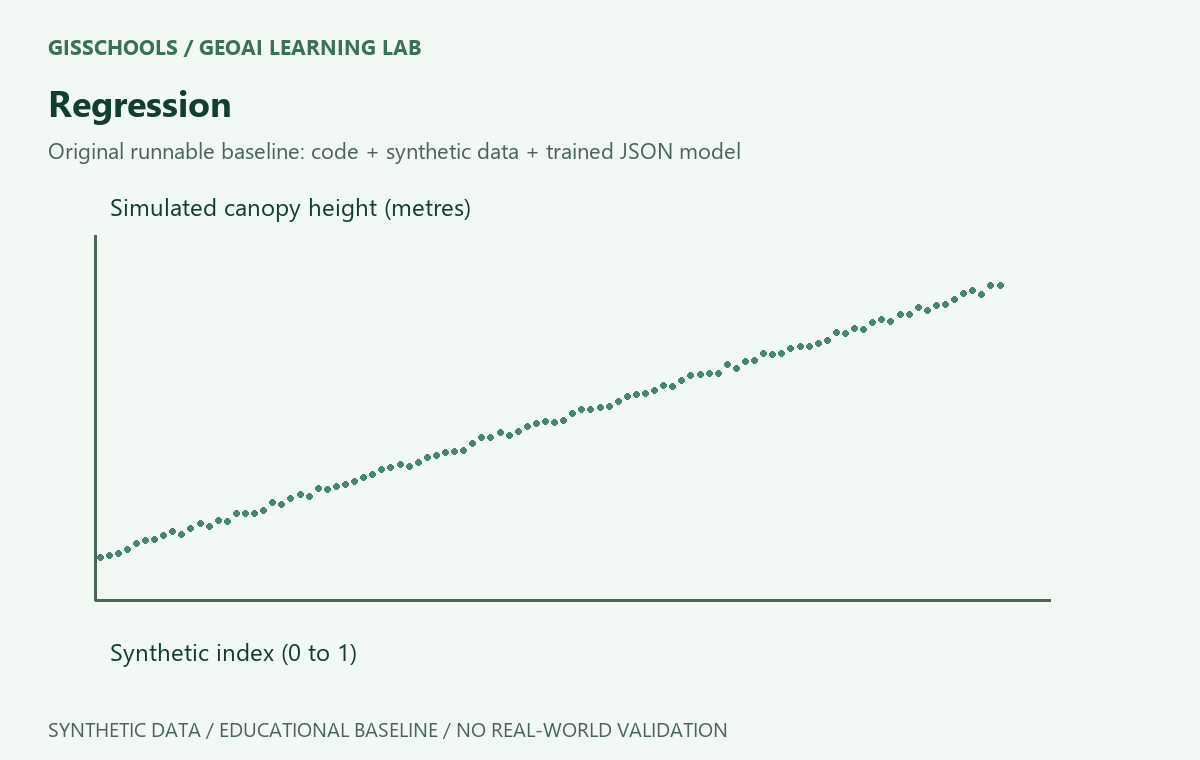
Learn a numeric relationship between a synthetic index and simulated canopy height. This is an original synthetic educational baseline, not a pretrained satellite model.
Model family and method
Ordinary least-squares linear regression. Training fits slope and intercept by ordinary least squares.
Inputs and outputs
training.csv uses x as a synthetic index and y as simulated height in metres. sample.json contains an x array.
Requirements
Python 3.9 or later. Standard library only; no GPU or extra packages.
How to train
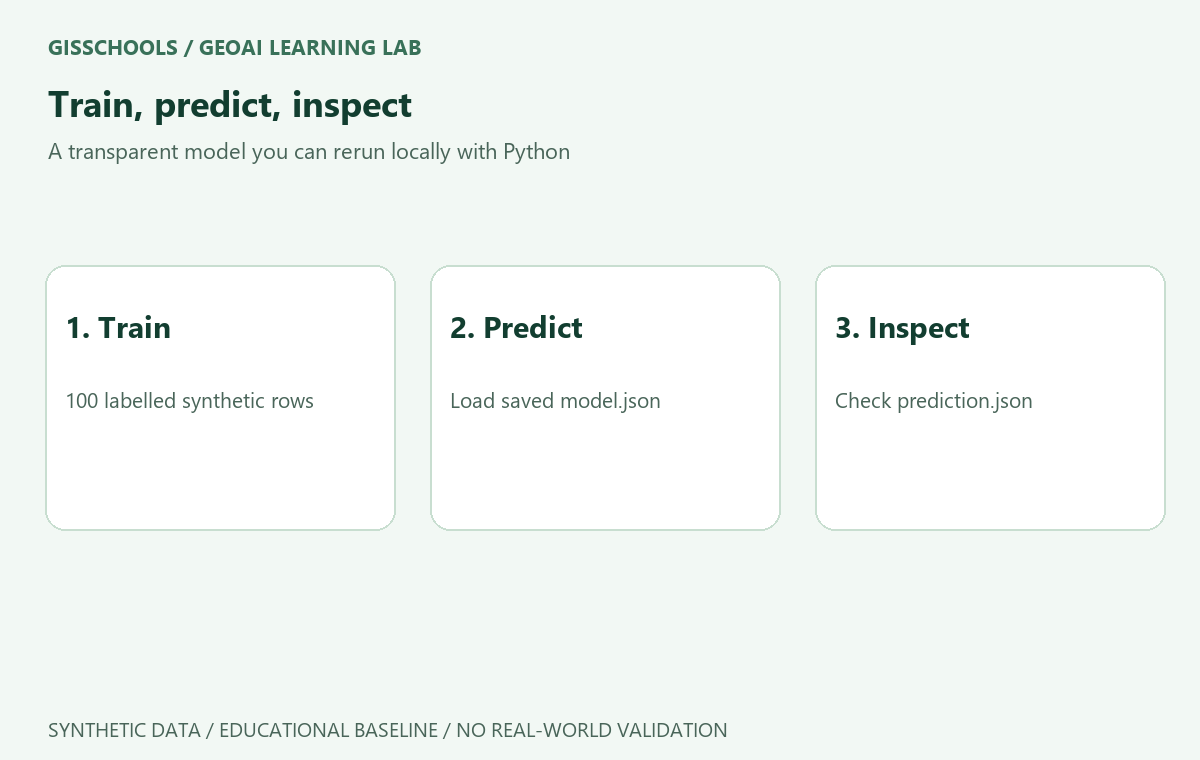
Download and extract the ZIP, then open a terminal inside the extracted folder. The package includes a model already trained on 100 synthetic rows.
python train.py
How to run and check
python predict.py
python verify.py
Read prediction.json for the output. The supplied fixture test passed locally; it is not an independent real-world accuracy benchmark.
Use your own data
Replace training.csv and sample.json using the same columns, units and shapes. Retrain and assess a separate held-out test set. The included verify.py and expected.json apply only to the original synthetic fixture. These scripts do not read GeoTIFFs or preserve a CRS.
Limitations
Both index and height values are invented. Predictions are in simulated metres and have no calibration to real vegetation. A single index cannot establish real canopy height. All sample data is synthetic; no real satellite or field validation is provided. Do not use the supplied parameters for operational mapping.
Included download
Training and prediction scripts, verification script, training CSV, sample inputs, expected outputs, trained model.json, prediction.json and README instructions. Original materials are released under CC0 1.0.
Examples and images
Comments
No comments yet. Start the discussion.
Leave a reply
Your email address will not be published. Required fields are marked.